Empirical design methods protect substations and transmission lines from lightning using practical experience. The two methods are fixed angles and empirical curves. Both give acceptable protection.
Fixed Angle Method of DSLP
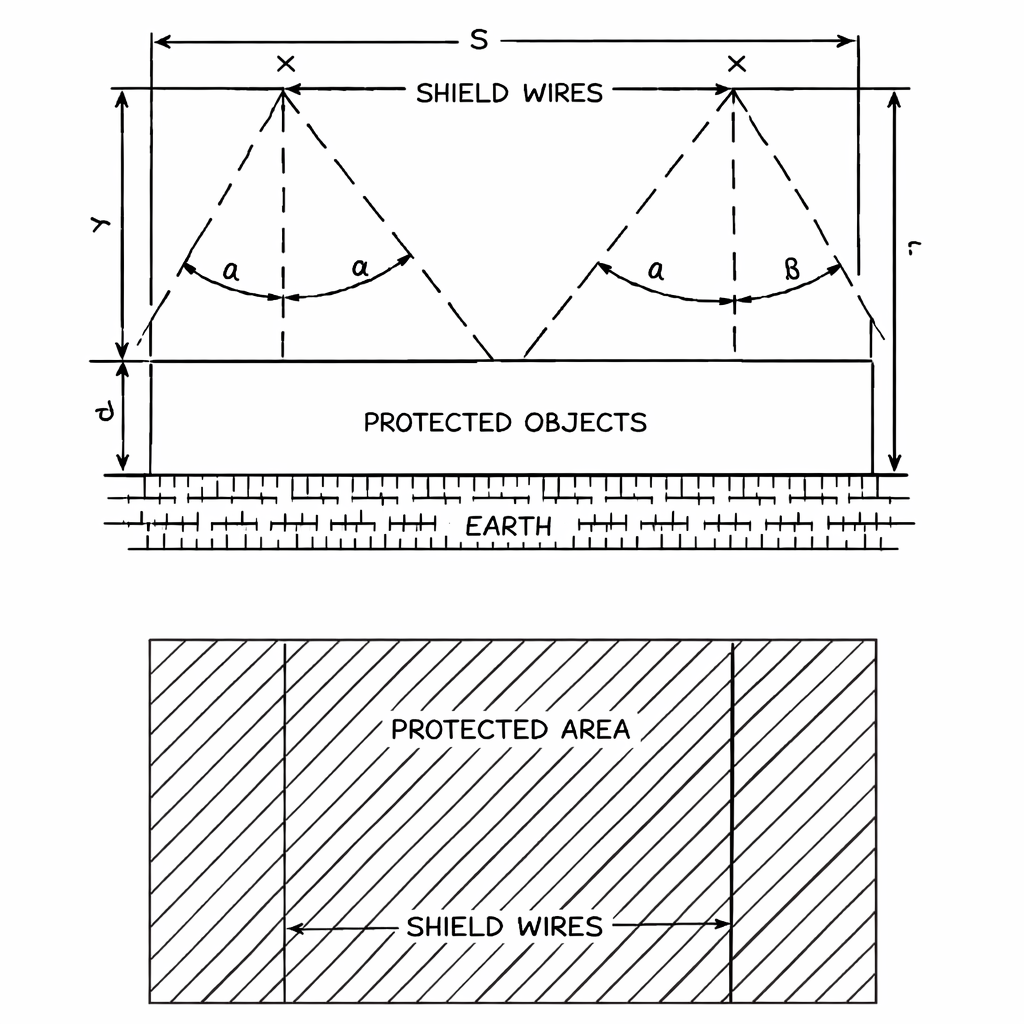
Here, we assume that a lightning mast or shielding wire protects an area below it within a fixed angle. It saves all equipment inside this solid angle. Obviousely, this method is simple, easy to use. The shielding angles depend on the lightning exposure level, the importance of the substation, and the size of the substation area. We commonly use angles of 45° for angle α and 30° or 45° for angle β.
When the height of masts or shielding wires increases, we can reduce the protective angle to improve lightning protection. This reduces the failure rate.
Horvath recommended different protective angles based on the height of the structure. He suggested an angle of 40°–45° for heights up to 15 m, 30° for heights between 15–25 m, and less than 20° for heights up to 50 m. These values ensure a shielding failure rate below 0.1–0.2 failures per 100 km per year. Horvath also suggested using the rolling sphere method to select suitable shielding angles based on conductor height.
Empirical Curves Method of DSLP
The empirical curves method originated from research published in 1941 by Wagner, McCann, and MacLane. Here, they used scale model tests with impulse voltages to simulate lightning strikes. Firstly, they focus on transmission lines. They studied where the discharge hit. Whether it is shield wire, conductor, or ground. Based on test results, they prepared curves showing lightning strike percentages. Also, they compared them with real transmission line scenarios. We have been using these curves for over 60 years.
In 1942, they further studied substation shielding. Then they produced curves relating height and spacing of shield wires and masts to failure rates. This method is more accurate than straight-line methods, and we still widely use it today for substation shielding.
Application of Empirical Curves
Engineers apply empirical curves using results from field lightning studies and laboratory model tests. These curves help decide the number, position, and height of shielding wires and lightning masts in substations. Designers develop curves for failure rates of 0.1%, 1%, 5%, 10%, and 15%. Most substation designs use a 0.1% failure rate.
The method uses simple ratios such as d/h, x/h, and s/h. Here, d represents the height of the protected equipment. The term h represents the height of the shielding wire or mast. The terms x and s represent horizontal spacing. Engineers calculate the shielding height from the d/h ratio. They then calculate horizontal spacing using the x/h or s/h ratio. Then they find the vertical clearance by subtracting d from h. They plot these values to obtain protection curves for different equipment heights.
To evaluate shielding performance, engineers first determine the ground flash density. They then calculate the number of lightning flashes striking the substation area. Finally, they multiply this value by the selected exposure rate, usually 0.1%, to estimate the number of lightning strokes that may penetrate the shield.